Barplot based on ggplot2
plot_barplot(
  object,
  fill = c("Kingdom", "Phylum", "Class", "Order", "Family", "Genus", "Species"),
  alluvial = FALSE,
  top_n = 5,
  show.legend,
  what = c("sum_intensity", "mean_intensity", "median_intensity"),
  na.rm = TRUE,
  relative = TRUE,
  re_calculate_relative = FALSE,
  x = "sample_id",
  color = "balck",
  facet_grid,
  ...
)

# S3 method for microbiome_dataset
plot_barplot(
  object,
  fill = c("Kingdom", "Phylum", "Class", "Order", "Family", "Genus", "Species"),
  alluvial = FALSE,
  top_n = 5,
  show.legend,
  what = c("sum_intensity", "mean_intensity", "median_intensity"),
  na.rm = TRUE,
  relative = TRUE,
  re_calculate_relative = FALSE,
  x = "sample_id",
  color = "balck",
  facet_grid,
  ...
)
Arguments
- object
microbiome_dataset
- fill
fill for barplot
- alluvial
Add alluvial or not.
- top_n
default is 5
- show.legend
show.legend or not
- what
which you want to mutate
- na.rm
na.rm
- relative
relative intensity or not.
- re_calculate_relative
re-calculate relative abundance or not.
- x
x axis
- color
color for barplot
- facet_grid
facet_grid
- ...
other params
Value
ggplot2 class object
Examples
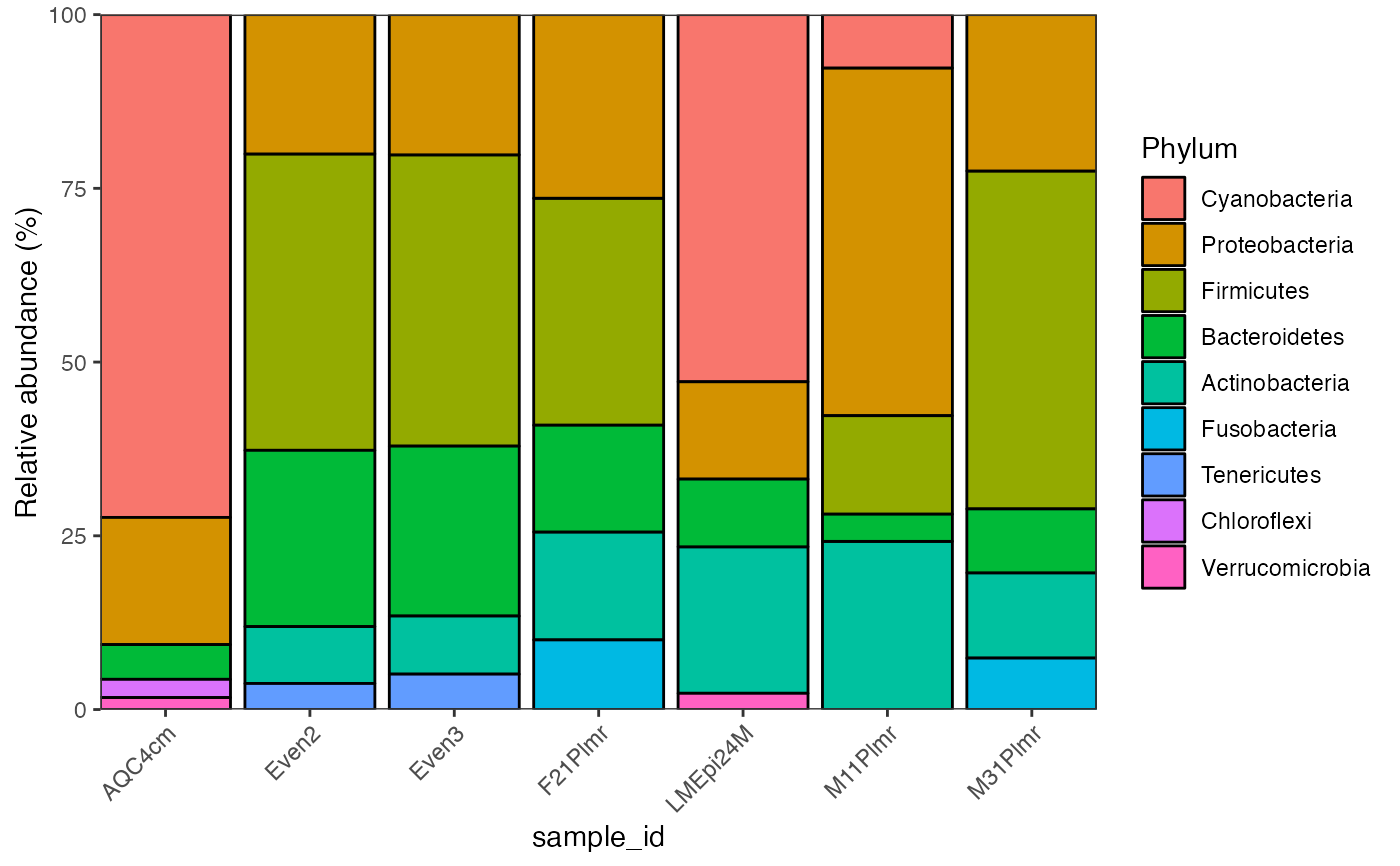
library(microbiomeplot)
data("global_patterns")
global_patterns %>%
activate_microbiome_dataset(what = "sample_info") %>%
filter(SampleType %in% c("Feces", "Mock")) %>%
plot_barplot(fill = "Phylum")
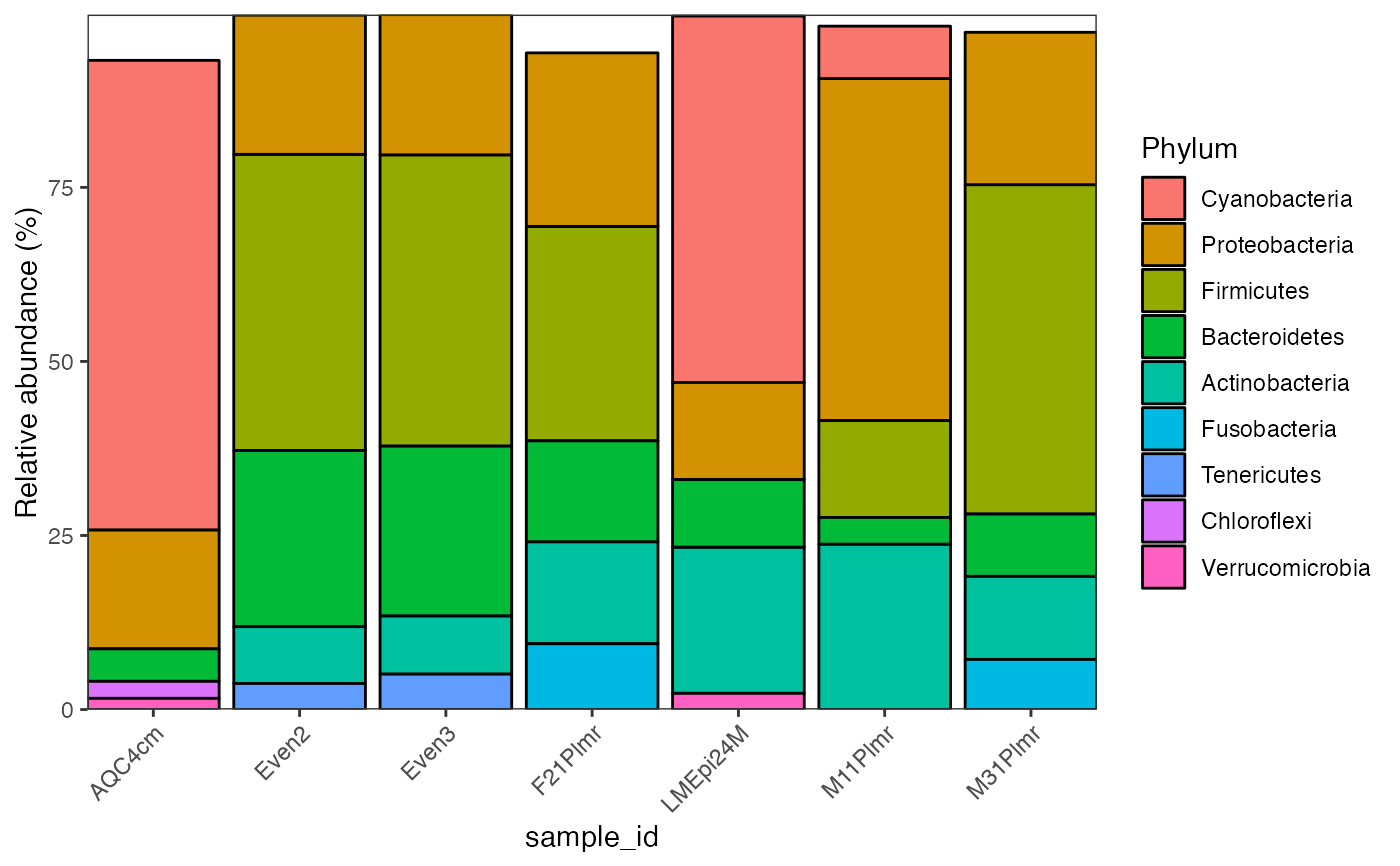 global_patterns %>%
activate_microbiome_dataset(what = "sample_info") %>%
filter(SampleType %in% c("Feces", "Mock")) %>%
plot_barplot(
fill = "Phylum",
relative = TRUE,
re_calculate_relative = TRUE,
show.legend = TRUE
)
global_patterns %>%
activate_microbiome_dataset(what = "sample_info") %>%
filter(SampleType %in% c("Feces", "Mock")) %>%
plot_barplot(
fill = "Phylum",
relative = TRUE,
re_calculate_relative = TRUE,
show.legend = TRUE
)
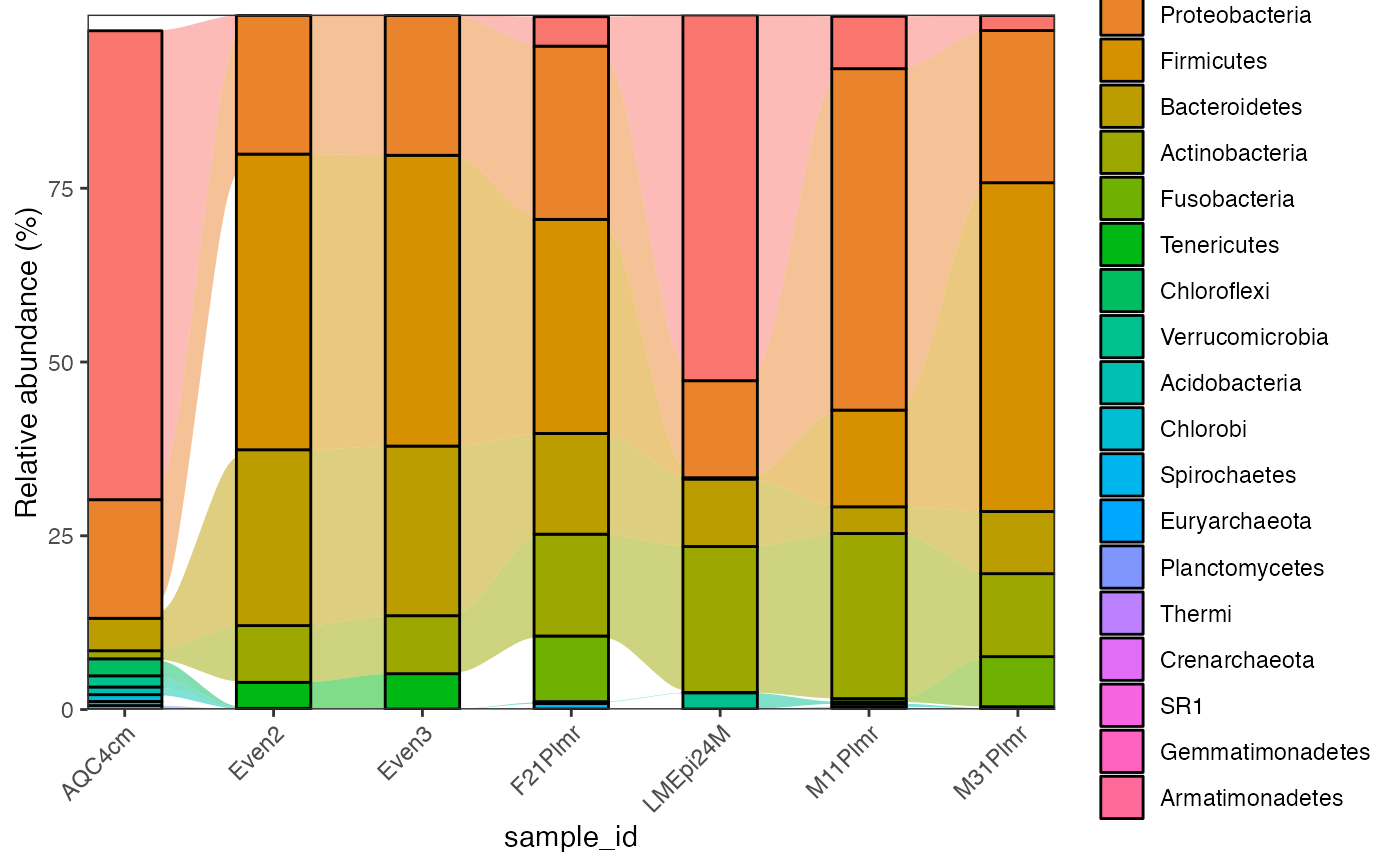
 global_patterns %>%
activate_microbiome_dataset(what = "sample_info") %>%
filter(SampleType %in% c("Feces", "Mock")) %>%
plot_barplot(fill = "Phylum",
alluvial = TRUE,
top_n = 10)
global_patterns %>%
activate_microbiome_dataset(what = "sample_info") %>%
filter(SampleType %in% c("Feces", "Mock")) %>%
plot_barplot(fill = "Phylum",
alluvial = TRUE,
top_n = 10)
 global_patterns %>%
activate_microbiome_dataset(what = "sample_info") %>%
filter(SampleType %in% c("Feces", "Mock")) %>%
plot_barplot(
fill = "Phylum",
relative = TRUE,
re_calculate_relative = TRUE,
show.legend = TRUE,
alluvial = TRUE,
top_n = 10
)
global_patterns %>%
activate_microbiome_dataset(what = "sample_info") %>%
filter(SampleType %in% c("Feces", "Mock")) %>%
plot_barplot(
fill = "Phylum",
relative = TRUE,
re_calculate_relative = TRUE,
show.legend = TRUE,
alluvial = TRUE,
top_n = 10
)
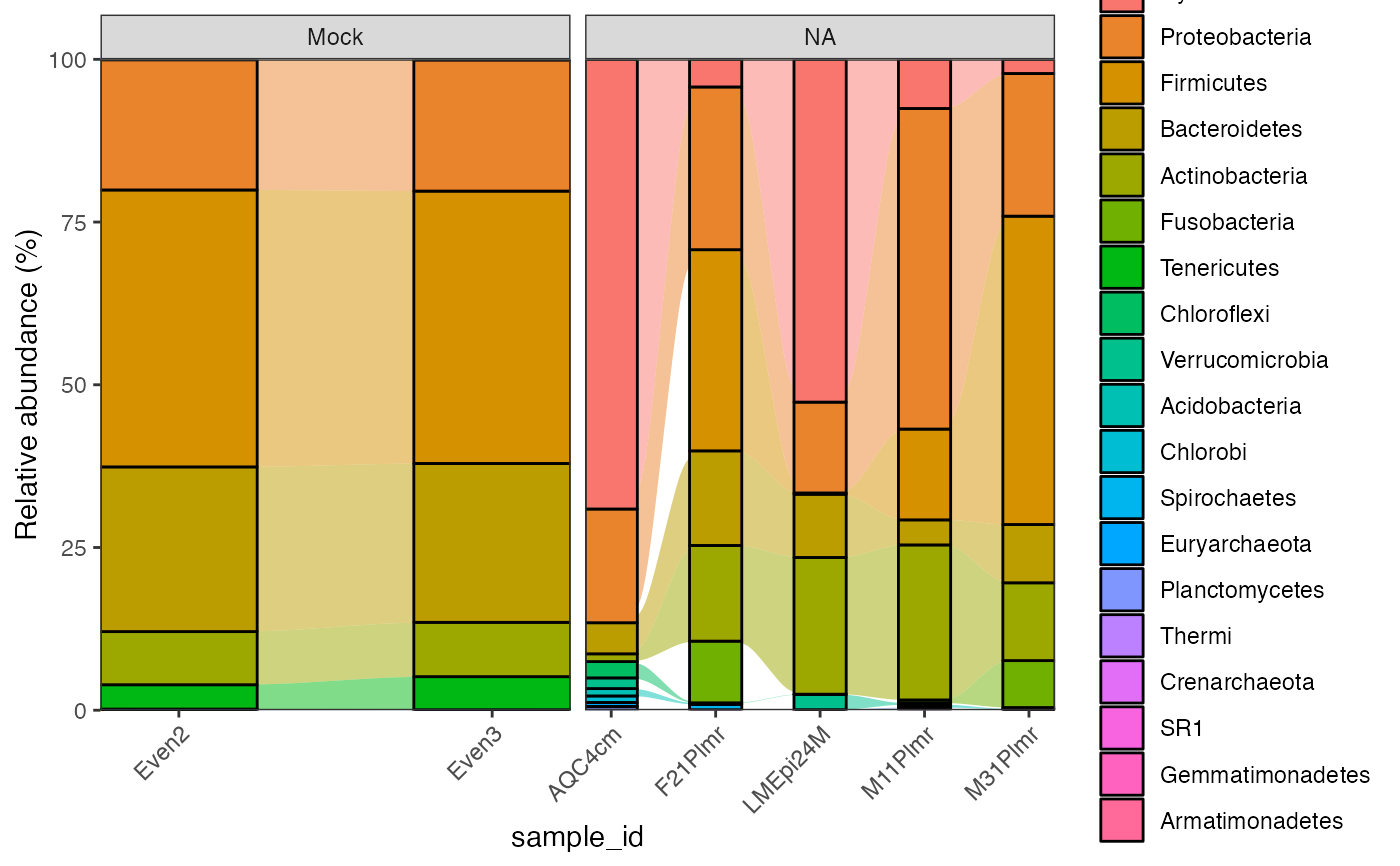
 global_patterns %>%
activate_microbiome_dataset(what = "sample_info") %>%
filter(SampleType %in% c("Feces", "Mock")) %>%
plot_barplot(
fill = "Phylum",
relative = TRUE,
re_calculate_relative = TRUE,
show.legend = TRUE,
alluvial = TRUE,
top_n = 10,
facet_grid = "SampleType"
)
global_patterns %>%
activate_microbiome_dataset(what = "sample_info") %>%
filter(SampleType %in% c("Feces", "Mock")) %>%
plot_barplot(
fill = "Phylum",
relative = TRUE,
re_calculate_relative = TRUE,
show.legend = TRUE,
alluvial = TRUE,
top_n = 10,
facet_grid = "SampleType"
)